Machine Learning: Difference between revisions
| (26 intermediate revisions by the same user not shown) | |||
| Line 30: | Line 30: | ||
: 1h 53m | : 1h 53m | ||
: Offered by: coursera | : Offered by: coursera | ||
: https:// | : https://www.coursera.org/learn/what-is-datascience | ||
: Status: Completed | : Status: Completed | ||
: Grade Achieved 95.83% | : Grade Achieved 95.83% | ||
: https://coursera.org/share/70426ac18b9271d5b95a8d787d60c2b2 | |||
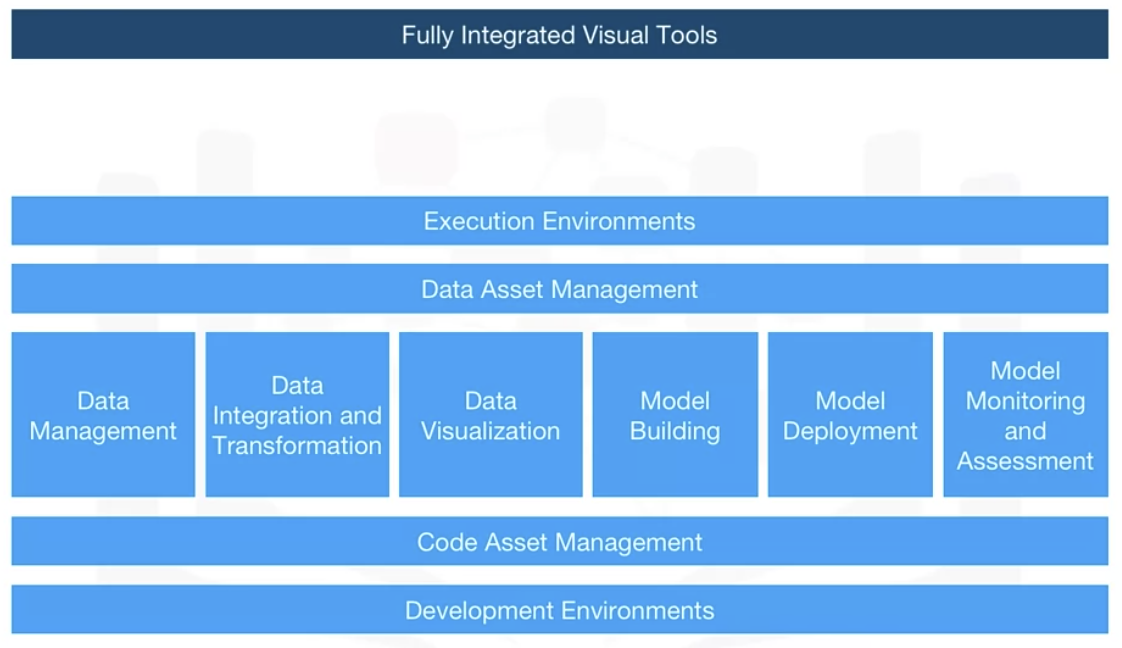
[[image:Cognitive_Class_-_What_is_Data_Science.png|200px]][[Image:What_is_data_science.png|200px]] | |||
( https://www.credly.com/org/ibm/badge/data-science-orientation) | |||
''Take aways / Key points:'' | |||
* A data scientist uses data to find solutions to problems and tells stories to communicate their findings. | |||
* Data science is the study of large quantities of data, which can reveal insights that help organizations make strategic choices. | |||
* Qualities of an analyst as per Murtaza Haider ( Ryerson University / Ted Rogers School of business): | |||
** curious | |||
** judgemental | |||
** argumentative | |||
* Terms to know: | |||
** Overfitting. | |||
** In-sample forecast | |||
Commentary: | |||
This course was weak. | |||
The course basically makes three points: | |||
# "You should get into data science, it's cool and there is a need." | |||
# "Here are some examples of problems solved with machine learning." | |||
# "Here is how to make a report. Cover page, summary , conclusion etc." | |||
All three are low value in my opinion. | |||
I want to get to the meat and start "doing it" not talking about how great it is. | |||
=== Tools for Data Science === | |||
: Instructurs: | |||
: Aije Egwaikhide - Senior Data Scientist -IBM | |||
: Svetlana Levitan - Senior Developer Advocate with IBM Center for Open Data and AI Technologies | |||
: Romeo Kienzler - Chief Data Scientist, Course Lead - IBM Watson IoT | |||
: When: August 2021 | |||
: level: ?? | |||
: Time : | |||
: Offered by: coursera | |||
: https://www.coursera.org/learn/open-source-tools-for-data-science | |||
: Status: In progress | |||
[[ | [[image:datasciencetools.png]] | ||
=== Understanding Machine Learning with Python === | === Understanding Machine Learning with Python === | ||
| Line 170: | Line 211: | ||
https://app.pluralsight.com/library/courses/managing-machine-learning-projects-google-cloud/table-of-contents | https://app.pluralsight.com/library/courses/managing-machine-learning-projects-google-cloud/table-of-contents | ||
=== Data Analysis with Python === | |||
https://cognitiveclass.ai/courses/data-analysis-python | |||
=== Data Visualization with Python === | === Data Visualization with Python === | ||
https://www.coursera.org/learn/python-for-data-visualization | https://www.coursera.org/learn/python-for-data-visualization | ||
https://cognitiveclass.ai/courses/data-visualization-python ( same course ? ) | |||
=== ThinkStats2 book === | |||
https://github.com/AllenDowney/ThinkStats2 | |||
of interest: brfss data processing ( https://www.cdc.gov/brfss/annual_data/annual_2020.html ) | |||
=== Learn ML with Tensor Flow === | |||
* https://www.tensorflow.org/resources/learn-ml? | |||
== algorithms == | == algorithms == | ||
| Line 188: | Line 246: | ||
;1D concolution net for sequential data. | ;1D concolution net for sequential data. | ||
: https://www.enterprisedb.com/blog/machine-learning-capacity-management | : https://www.enterprisedb.com/blog/machine-learning-capacity-management | ||
; [[/Dynamic Time Warping]] | |||
Can be used to do cluster anlysis on sequential data. | |||
; Discrete Frechet Distance | |||
: minimize distance of chord between curves. | |||
== Concepts and Techniques == | |||
onehotencorder: TOREAD | |||
https://towardsdatascience.com/choosing-the-right-encoding-method-label-vs-onehot-encoder-a4434493149b | |||
scalers: | |||
https://scikit-learn.org/stable/auto_examples/preprocessing/plot_all_scaling.html#sphx-glr-auto-examples-preprocessing-plot-all-scaling-py | |||
;scaling features to a range | |||
:https://scikit-learn.org/stable/modules/preprocessing.html#scaling-features-to-a-range | |||
== tools == | == tools == | ||
| Line 206: | Line 283: | ||
TensorFlow Playground | TensorFlow Playground | ||
http://playground.tensorflow.org | http://playground.tensorflow.org | ||
=== visualize a tensor === | |||
reference: https://stackoverflow.com/questions/68510066/how-to-plot-a-3dimensional-tensor-as-a-tube-with-different-colors | |||
<pre> | |||
import matplotlib.pyplot as plt | |||
import numpy as np | |||
axes = [16, 16, 16] # change to 64 | |||
traj = np.random.choice([-1,1], axes) | |||
alpha = 0.9 | |||
colors = np.empty(axes + [4], dtype=np.float32) | |||
colors[traj==1] = [1, 0, 0, alpha] # red | |||
colors[traj==-1] = [0, 0, 1, alpha] # blue | |||
fig = plt.figure() | |||
ax = fig.add_subplot(projection='3d') | |||
ax.voxels(traj, facecolors=colors, edgecolors='black') | |||
plt.show() | |||
</pre> | |||
== sample data == | == sample data == | ||
| Line 285: | Line 384: | ||
https://github.com/a-martyn/ISL-python Introduction to statistical learning | https://github.com/a-martyn/ISL-python Introduction to statistical learning | ||
* [https://medium.com/back-to-the-napkin/eight-guidelines-that-will-help-you-execute-your-data-science-initiatives-with-excellence-a87006156100 Eight guidelines that will help you execute your data science initiatives with excellence] - [[/8 Guidelines: Data Science Initiative Excellence]] - local copy + notes | |||
Flight price prediction: | |||
* https://github.com/dsrscientist/Data-Science-ML-Capstone-Projects | |||
* https://medium.com/code-to-express/flight-price-prediction-7c83616a13bb | |||
anovos feature engineering orkshop: https://www.crowdcast.io/e/feature-engineering-workshop | |||
=== NIPS - Neural Information Processing Systems === | === NIPS - Neural Information Processing Systems === | ||
| Line 290: | Line 397: | ||
* 2015 https://nips.cc/Conferences/2015 | * 2015 https://nips.cc/Conferences/2015 | ||
* 2016 https://nips.cc/Conferences/2016 | * 2016 https://nips.cc/Conferences/2016 | ||
=== Models to check out === | |||
from: https://shopify.engineering/introducing-linnet-using-rich-image-text-data-categorize-products | |||
* Multi-Lingual BERT for text | |||
* MobileNet-V2 for images | |||
== Demos and Labs == | == Demos and Labs == | ||
Latest revision as of 15:38, 24 July 2024
getting started
google://getting started with machine learning
https://www.kaggle.com/wiki/GettingStartedWithPythonForDataScience - in progress
https://www.quora.com/I-want-to-learn-machine-learning-Where-should-I-start
http://thunderboltlabs.com/blog/2013/11/09/getting-started-with-machine-learning/
http://machinelearningmastery.com/machine-learning-for-programmers/
https://www.kaggle.com/dfernig/reddit-comments-may-2015/the-biannual-reddit-sarcasm-hunt/code
course: at coursera https://www.coursera.org/learn/machine-learning/home/week/1
understanding machine learning theory algorithms
Course Plan
What is Data Science? ( IBM )
Data Science Orientation Issued by IBM
- By IBM
- August 2021
- Beginner
- 1h 53m
- Offered by: coursera
- https://www.coursera.org/learn/what-is-datascience
- Status: Completed
- Grade Achieved 95.83%
- https://coursera.org/share/70426ac18b9271d5b95a8d787d60c2b2

 ( https://www.credly.com/org/ibm/badge/data-science-orientation)
Take aways / Key points:
- A data scientist uses data to find solutions to problems and tells stories to communicate their findings.
- Data science is the study of large quantities of data, which can reveal insights that help organizations make strategic choices.
- Qualities of an analyst as per Murtaza Haider ( Ryerson University / Ted Rogers School of business):
- curious
- judgemental
- argumentative
- Terms to know:
- Overfitting.
- In-sample forecast
Commentary:
This course was weak.
The course basically makes three points:
- "You should get into data science, it's cool and there is a need."
- "Here are some examples of problems solved with machine learning."
- "Here is how to make a report. Cover page, summary , conclusion etc."
All three are low value in my opinion.
I want to get to the meat and start "doing it" not talking about how great it is.
Tools for Data Science
- Instructurs:
- Aije Egwaikhide - Senior Data Scientist -IBM
- Svetlana Levitan - Senior Developer Advocate with IBM Center for Open Data and AI Technologies
- Romeo Kienzler - Chief Data Scientist, Course Lead - IBM Watson IoT
- When: August 2021
- level: ??
- Time :
- Offered by: coursera
- https://www.coursera.org/learn/open-source-tools-for-data-science
- Status: In progress
Understanding Machine Learning with Python
- By Jerry Kurata
- May 16, 2016
- Beginner
- This is rated 4.52821 (638)
- 1h 53m
- Offered by: pluralsight
- https://app.pluralsight.com/library/courses/python-understanding-machine-learning/table-of-contents
- Status: Not started
Work Flow Guidelines:
1. Early Steps are most important. Each step depends o previous steps.
2. Expect to move backwards. Later knowledge effects previous steps.
3. Data is never as you need it. Data will have to be altered.
4. More data is better. More data leads to better results.
5. Don't pursue a bad solution. reevaluate, fix, or quit.
Building Machine Learning Models in SQL Using BigQuery ML
- Building Machine Learning Models in SQL Using BigQuery ML
- By Janani Ravi
- Nov 19, 2018
- Beginner
- This is rated 4.92308 (13)
- 1h 27m
- Offered by pluralsight
- https://app.pluralsight.com/library/courses/sql-bigquery-ml-building-machine-learning-models/table-of-contents
- Status: Not started
Preparing Data for Machine Learning
Preparing Data for Machine Learning By Janani Ravi Oct 28, 2019 Beginner This is rated 4.4375 (32) 3h 24m https://app.pluralsight.com/library/courses/preparing-data-machine-learning/table-of-contents
Preparing Data for Feature Engineering and Machine Learning
Preparing Data for Feature Engineering and Machine Learning By Janani Ravi Oct 28, 2019 Beginner This is rated 4.64 (25) 3h 17m https://app.pluralsight.com/library/courses/preparing-data-feature-engineering-machine-learning/table-of-contents
Building End-to-end Machine Learning Workflows with Kubeflow
Building End-to-end Machine Learning Workflows with Kubeflow By Abhishek Kumar Apr 23, 2020 Beginner No Rating 3h 30m https://app.pluralsight.com/library/courses/building-end-to-end-machine-learning-workflows-kubeflow/table-of-contents
Data Wrangling with Pandas for Machine Learning Engineers
- Data Wrangling with Pandas for Machine Learning Engineers
- By Mike West
- Aug 08, 2018
- Beginner
- This is rated 3.82051 (39)
- 1h
- https://app.pluralsight.com/library/courses/pandas-data-wrangling-machine-learning-engineers/table-of-contents
Building Your First scikit-learn Solution
- Building Your First scikit-learn Solution
- By Janani Ravi
- May 01, 2019
- Beginner
- This is rated 4.7377 (61)
- 2h 7m
- https://app.pluralsight.com/library/courses/building-first-scikit-learn-solution/table-of-contents
Build, Train, and Deploy Your First Neural Network with TensorFlow
- Build, Train, and Deploy Your First Neural Network with TensorFlow
- By Jerry Kurata
- Jan 22, 2020
- Beginner
- This is rated 4.58333 (36)
- 2h 47m
- https://app.pluralsight.com/library/courses/build-train-deploy-first-neural-network-tensorflow/table-of-contents
Network Analysis in Python: Getting Started
- Network Analysis in Python: Getting Started
- By Artur Krochin
- Apr 09, 2019
- Beginner
- This is rated 4.92857 (14)
- 1h 58m
- https://app.pluralsight.com/library/courses/python-network-analysis-getting-started/table-of-contents
Building Features from Numeric Data
- Building Features from Numeric Data
- By Janani Ravi
- Apr 07, 2019
- Beginner
- This is rated 5 (15)
- 2h 25m
- https://app.pluralsight.com/library/courses/building-features-numeric-data/table-of-contents
More
https://app.pluralsight.com/library/courses/applying-machine-learning-data-gcp/table-of-contents
Data Analysis with Python
https://cognitiveclass.ai/courses/data-analysis-python
Data Visualization with Python
https://www.coursera.org/learn/python-for-data-visualization
https://cognitiveclass.ai/courses/data-visualization-python ( same course ? )
ThinkStats2 book
https://github.com/AllenDowney/ThinkStats2
of interest: brfss data processing ( https://www.cdc.gov/brfss/annual_data/annual_2020.html )
Learn ML with Tensor Flow
algorithms
- random forest
- https://medium.com/rants-on-machine-learning/the-unreasonable-effectiveness-of-random-forests-f33c3ce28883
- Nearest Neighbors Classification
- http://scikit-learn.org/stable/modules/neighbors.html
- 1D concolution net for sequential data.
- https://www.enterprisedb.com/blog/machine-learning-capacity-management
Can be used to do cluster anlysis on sequential data.
- Discrete Frechet Distance
- minimize distance of chord between curves.
Concepts and Techniques
onehotencorder: TOREAD
https://towardsdatascience.com/choosing-the-right-encoding-method-label-vs-onehot-encoder-a4434493149b
scalers:
- scaling features to a range
- https://scikit-learn.org/stable/modules/preprocessing.html#scaling-features-to-a-range
tools
python + libs
- SystemML- a Universal Translator for Big Data and Machine Learning
image labeling
https://github.com/Labelbox/Labelbox
TensorFlow Playground
http://playground.tensorflow.org
visualize a tensor
import matplotlib.pyplot as plt
import numpy as np

axes = [16, 16, 16] # change to 64
traj = np.random.choice([-1,1], axes)

alpha = 0.9
colors = np.empty(axes + [4], dtype=np.float32)
colors[traj==1] = [1, 0, 0, alpha]  # red
colors[traj==-1] = [0, 0, 1, alpha]  # blue

fig = plt.figure()
ax = fig.add_subplot(projection='3d')
ax.voxels(traj, facecolors=colors, edgecolors='black')
plt.show()
sample data
blogs
Cool Projects
https://github.com/aficnar/slackpolice
- Aerospace Controls Lab
- http://acl.mit.edu/
- https://www.youtube.com/channel/UCVTxuaJsdMrk3UEcHVll9Yg
https://qz.ai/spotting-circling-helicopters/
Data leaks
When data associated iwth the data set gives away the target data.
Primarily of concern in competition.
Unexpected data.
refrence: https://www.coursera.org/learn/competitive-data-science/lecture/5w9Gy/basic-data-leaks
Future peaking - using time series data that's not in the target time period, for example in the future.
Meta data leaks - for example file meta data, zip file meta data, image file meta data.
information hidden in ID and hashes,
and information hidden in row order and possibly duplicate rows
Questions and Investigation
What are "ground truths"?
corteges - what is this word
/Courera's Competitive Data Science Course
Reading Room
- an good overview the the data science cycle in a general sense: https://cloud.google.com/ml-engine/docs/tensorflow/data-prep
- Detecting tanks https://www.jefftk.com/p/detecting-tanks
- Kaggle competitions: https://www.kaggle.com/
- University of Toronto Machine Learning http://www.learning.cs.toronto.edu/theses.html
Past solutions
http://ndres.me/kaggle-past-solutions/
https://www.kaggle.com/wiki/PastSolutions
http://www.chioka.in/kaggle-competition-solutions/
https://github.com/ShuaiW/kaggle-classification/
https://towardsdatascience.com/how-to-use-dataset-in-tensorflow-c758ef9e4428
https://towardsdatascience.com/how-to-train-neural-network-faster-with-optimizers-d297730b3713
Light House Labs data challenge
https://github.com/a-martyn/ISL-python Introduction to statistical learning
- Eight guidelines that will help you execute your data science initiatives with excellence - /8 Guidelines: Data Science Initiative Excellence - local copy + notes
Flight price prediction:
- https://github.com/dsrscientist/Data-Science-ML-Capstone-Projects
- https://medium.com/code-to-express/flight-price-prediction-7c83616a13bb
anovos feature engineering orkshop: https://www.crowdcast.io/e/feature-engineering-workshop
NIPS - Neural Information Processing Systems
Models to check out
from: https://shopify.engineering/introducing-linnet-using-rich-image-text-data-categorize-products
- Multi-Lingual BERT for text
- MobileNet-V2 for images
Demos and Labs
https://codelabs.developers.google.com/codelabs/scd-babyweight2/index.html#0
https://github.com/GoogleCloudPlatform/training-data-analyst
- Jaz Quick start
- use your GPU / TPU for ML:
- https://jax.readthedocs.io/en/latest/notebooks/quickstart.html
Image processing
- Christopheraburns / gluoncv-yolo-playing_cards
- https://github.com/Christopheraburns/gluoncv-yolo-playing_cards/blob/master/Yolov3.ipynb
Chapter
https://github.com/FlorianMuellerklein/Machine-Learning
Improving our neural network (96% MNIST) https://databoys.github.io/ImprovingNN/
https://iamtrask.github.io/2015/07/12/basic-python-network/
https://plot.ly/python/create-online-dashboard/
https://www.anaconda.com/download/
http://jupyter.org/install.html
https://jakevdp.github.io/PythonDataScienceHandbook/
linear regression in 6 lines of code
source: https://towardsdatascience.com/linear-regression-in-6-lines-of-python-5e1d0cd05b8d
pip install scikit-learn
import numpy as np
import matplotlib.pyplot as plt  # To visualize
import pandas as pd  # To read data
from sklearn.linear_model import LinearRegression
data = pd.read_csv('data.csv')  # load data set
X = data.iloc[:, 0].values.reshape(-1, 1)  # values converts it into a numpy array
Y = data.iloc[:, 1].values.reshape(-1, 1)  # -1 means that calculate the dimension of rows, but have 1 column
linear_regressor = LinearRegression()  # create object for the class
linear_regressor.fit(X, Y)  # perform linear regression
Y_pred = linear_regressor.predict(X)  # make predictions
plt.scatter(X, Y)
plt.plot(X, Y_pred, color='red')
plt.show()
Conferences
- TMLS2020 - Toronto Machine Learning Summit 2020
