Temperature Sensor Setup LM35 take one: Difference between revisions
From Federal Burro of Information
Jump to navigationJump to search
No edit summary |
No edit summary |
||
| (5 intermediate revisions by the same user not shown) | |||
| Line 27: | Line 27: | ||
rrdtool fetch 1k_5v.rrd AVERAGE --start `date --date='1 hour ago' +%s` --end `date +%s` | rrdtool fetch 1k_5v.rrd AVERAGE --start `date --date='1 hour ago' +%s` --end `date +%s` | ||
while true; | |||
do | |||
rrdtool update 1k_5v.rrd `date +%s`:`/usr/local/projects/k8055/src/k8055 -q -num:10 -delay:1000 2>/dev/null | cut -d ";" -f 3 | awk '{sum=sum+$1}END{print sum/NR}'`; | |||
sleep 300; | |||
done | |||
<pre> | <pre> | ||
rrdtool graph 1k_5v.png \ | rrdtool graph 1k_5v.png \ | ||
--start `date --date=' | --start `date --date='7 days ago' +%s` --end `date +%s` \ | ||
DEF:myavg=1k_5v.rrd:temp:AVERAGE \ | DEF:myavg=1k_5v.rrd:temp:AVERAGE \ | ||
LINE2:myavg#FF0000 \ | LINE2:myavg#FF0000 \ | ||
| Line 39: | Line 46: | ||
</pre> | </pre> | ||
After collecting data for a bit: | |||
[[Image:1k_5v_001.png]] | |||
Note that the variable resistor on the k8055 is set right to middle. | |||
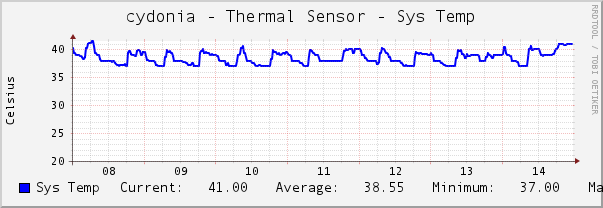
Compared to system temp of server which is a loose aproximation of ambient local temperature ( the lm35 is sitting right beside the server's system temperature sensor. | |||
[[Image: | [[Image:cydonia-thermal-sensor-sys-temp-cacti.png]] | ||
I have moved the variable resistor to the right by one quarter so it's now half way between the halfway and all the way clockwise. | |||
Initial investigation shows that where before it was reading 6 it's now reading 9. We shall see how it effects collection. | |||
[[Category:Computers]] | |||
[[ | [[Category:Electronics]] | ||
Latest revision as of 15:31, 12 March 2021
k8055 connected to an lm35 with a1k resistor at 5v.
here's how I get the data into an rrd and graphed:
rrdtool create 1k_5v.rrd           \
            --start `date +%s`     \
            DS:speed:GAUGE:600:U:U \
            RRA:AVERAGE:0.5:1:24   \
            RRA:AVERAGE:0.5:6:10
new more robust rrd:
rrdtool create 1k_5v.rrd --step 300 \
  DS:temp:GAUGE:600:0:256 \
  RRA:AVERAGE:0.5:1:2592000 \ # Two months of 5 minute average data
  RRA:MIN:0.5:12:2400 \ # 100 days of 1 hour MAX data
  RRA:MAX:0.5:12:2400 \ # 100 days of 1 hour MIN data
  RRA:AVERAGE:0.5:12:2400 # 100 days of 1 hour AVERAGE data
drop this in a 5 minute while loop:
rrdtool update 1k_5v.rrd `date +%s`:`/usr/local/projects/k8055/src/k8055 -q -num:10 -delay:1000 2>/dev/null | cut -d ";" -f 3 | awk '{sum=sum+$1}END{print sum/NR}'`
rrdtool fetch 1k_5v.rrd AVERAGE --start `date --date='1 hour ago' +%s` --end `date +%s`
while true;
do
rrdtool update 1k_5v.rrd `date +%s`:`/usr/local/projects/k8055/src/k8055 -q -num:10 -delay:1000 2>/dev/null | cut -d ";" -f 3 | awk '{sum=sum+$1}END{print sum/NR}'`;
sleep 300;
done
rrdtool graph 1k_5v.png                                          \
         --start `date --date='7 days ago' +%s` --end `date +%s` \
         DEF:myavg=1k_5v.rrd:temp:AVERAGE                      \
         LINE2:myavg#FF0000                                      \
         DEF:mymin=1k_5v.rrd:temp:MIN                      \
         LINE2:mymin#00FF00                                   \
         DEF:mymax=1k_5v.rrd:temp:MAX                      \
         LINE2:mymax#0000FF
After collecting data for a bit:
Note that the variable resistor on the k8055 is set right to middle.
Compared to system temp of server which is a loose aproximation of ambient local temperature ( the lm35 is sitting right beside the server's system temperature sensor.
I have moved the variable resistor to the right by one quarter so it's now half way between the halfway and all the way clockwise.
Initial investigation shows that where before it was reading 6 it's now reading 9. We shall see how it effects collection.

