Temperature Sensor Setup LM35 take one: Difference between revisions
From Federal Burro of Information
Jump to navigationJump to search
No edit summary |
No edit summary |
||
| Line 49: | Line 49: | ||
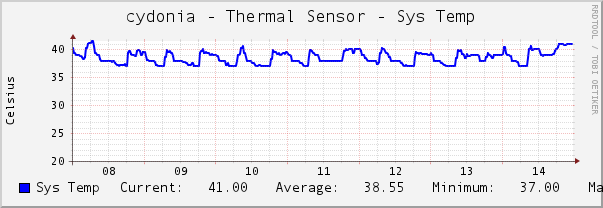
compared to system temp of server which is a loose aproximation of ambient local temperature ( the lm35 is sitting right beside the server's system temperature sensor. | compared to system temp of server which is a loose aproximation of ambient local temperature ( the lm35 is sitting right beside the server's system temperature sensor. | ||
[[cydonia-thermal-sensor-sys-temp-cacti.png]] | [[Image:cydonia-thermal-sensor-sys-temp-cacti.png]] | ||
Revision as of 04:31, 15 March 2010
k8055 connected to an lm35 with a1k resistor at 5v.
here's how I get the data into an rrd and graphed:
rrdtool create 1k_5v.rrd           \
            --start `date +%s`     \
            DS:speed:GAUGE:600:U:U \
            RRA:AVERAGE:0.5:1:24   \
            RRA:AVERAGE:0.5:6:10
new more robust rrd:
rrdtool create 1k_5v.rrd --step 300 \
  DS:temp:GAUGE:600:0:256 \
  RRA:AVERAGE:0.5:1:2592000 \ # Two months of 5 minute average data
  RRA:MIN:0.5:12:2400 \ # 100 days of 1 hour MAX data
  RRA:MAX:0.5:12:2400 \ # 100 days of 1 hour MIN data
  RRA:AVERAGE:0.5:12:2400 # 100 days of 1 hour AVERAGE data
drop this in a 5 minute while loop:
rrdtool update 1k_5v.rrd `date +%s`:`/usr/local/projects/k8055/src/k8055 -q -num:10 -delay:1000 2>/dev/null | cut -d ";" -f 3 | awk '{sum=sum+$1}END{print sum/NR}'`
rrdtool fetch 1k_5v.rrd AVERAGE --start `date --date='1 hour ago' +%s` --end `date +%s`
rrdtool graph 1k_5v.png                                          \
         --start `date --date='3 days ago' +%s` --end `date +%s` \
         DEF:myavg=1k_5v.rrd:temp:AVERAGE                      \
         LINE2:myavg#FF0000                                      \
         DEF:mymin=1k_5v.rrd:temp:MIN                      \
         LINE2:mymin#00FF00                                   \
         DEF:mymax=1k_5v.rrd:temp:MAX                      \
         LINE2:mymax#0000FF
and first prize for ugly mutt goes to.....
http://www.quadratic.net/1k_5v.png
after collecintg for a bit:
compared to system temp of server which is a loose aproximation of ambient local temperature ( the lm35 is sitting right beside the server's system temperature sensor.

