TMLS2020
Notes from chat channels
What are people working on?
Nov 16th
Workshops
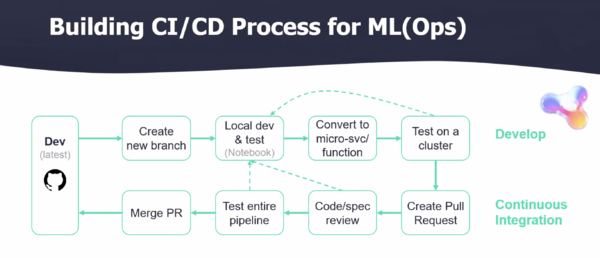
Topic: Workshop: MLOps & Automation Workshop: Bringing ML to Production in a Few Easy Steps
Time: Nov 16, 2020 09:00 AM Eastern Time (US and Canada)
who: Yaron Haviv https://medium.com/@yaronhaviv
Tools:
- mlrun - lots of end to end demos /demos
- nuclio
- kubeflow
What it gives us:
- CICD for ML
- auditability
- drift
- feature store for meta data, and drift.
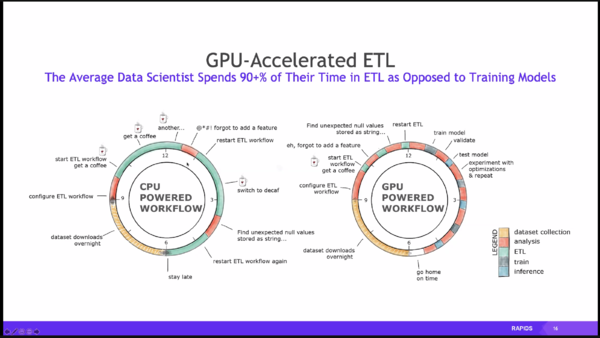
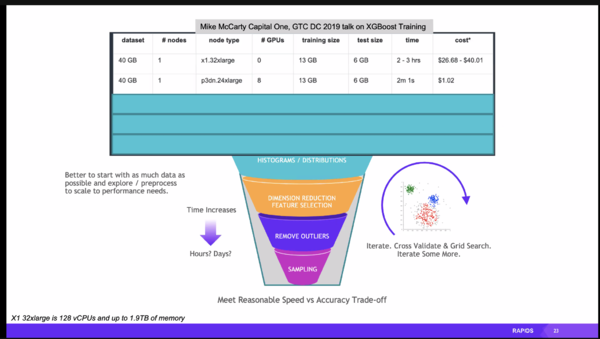
Topic: Reaching Lightspeed Data Science: ETL, ML, and Graph with NVIDIA RAPIDS
Time: Nov 16, 2020 11:00 AM Eastern Time (US and Canada)
https://github.com/dask/dask-tutorial
who: Bradley Rees ( from Nvidia )
https://medium.com/rapids-ai/gpu-dashboards-in-jupyter-lab-757b17aae1d5
https://nvidia.github.io/spark-rapids/
file formats:
h5 - for gentic info.
h5ad - compressed annotated version
nica lung
genetic analysis, 2d visualization
UMAP
- https://www.nature.com/articles/s41467-020-15351-4
- https://umap-learn.readthedocs.io/en/latest/basic_usage.html
Managing Data Science in the Enterprise
who:
- Randi J Ludwig , Sr. Manager Applied Data scientist - Dell Technologies
- Joshua Podulska - Chief Data scientist - Domino Data lab.
The age old “discipline” problem. This is not a data science problem and this is not a technology problem, this is a human problem.
"Paved paths"
kathy oneil weapons of math descruction
Nov 17th
Bonus Workshop: How to Automate Machine Learning With GitHub Actions
11:00 am
boring: what is docker? Skipped it.
Black-Box and Glass-Box Explanation in Machine Learning
who: Dave Scharbach who: rich cauruna
gradient boost decision tree
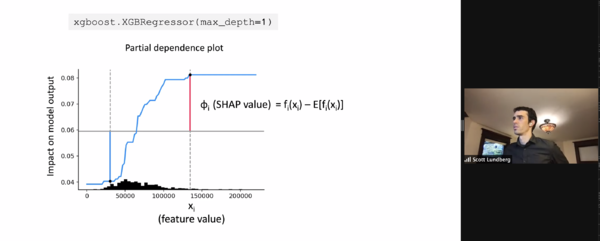
SHAP vales Shapley - the difference between the averge effect and the effect for the value.
linear model.
use "partial dependent plot " to see the effect of one input.
tree explainer for say GBM model.
two matrix: out matrix, and explainer matrix
output matrix has the same metrics, and explainer matrix has multple metrics.
bswarm plot
when you look at global summary stats, you wash away Rare high magnitude effect.
vertical dispersion.
interaction effect, agent and gender, there ar esome sublte bits,
we often see "treatment effects" if you BUN is higher than X then you get treatment Y, ergo the graph of BUN level has "notches" in it where treatments are triggered, drug .. dialysis, etc.
EBM - explainable booster machine - some in R and spark on the way.
Project: microsofts "interpret" package. EBM


